VPD (Vapor Pressure Deficit) is the amount of water the air can still absorb before it becomes saturated. It is the real driver behind transpiration, stomatal opening, and ultimately how your crop performs. Yet many growers treat VPD as something derived from temperature and humidity, when in reality it is the main signal steering the plant.
What exactly is VPD?
VPD is the gap between the amount of water vapor in the air and the maximum it can hold at that temperature. At a VPD of 0 kPa the air is saturated, and the vents, the glass, and eventually the leaves are all on the edge of condensation. At a high VPD, above 1.5 kPa, the air is thirsty and pulls water aggressively out of the leaf.
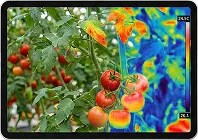
VPD is expressed in kPa (kilopascal) and calculated from air temperature, humidity, and, for the most accurate reading, leaf temperature. That last part is crucial: a leaf in full radiation can be 2 to 4 °C warmer than the air, which shifts the VPD at leaf level well away from what an aisle sensor measures.
Why VPD matters for your crop
VPD drives three processes at once:
- Transpiration: the higher the VPD, the faster water evaporates from the leaf. That evaporation cools the plant and keeps the water stream moving through it.
- Stomata: when VPD climbs too high, the crop closes its stomata to avoid drying out. That stops CO₂ uptake, and with it photosynthesis.
- Calcium uptake: calcium moves only with the transpiration stream. No transpiration, no calcium. No calcium means blossom end rot in tomatoes, peppers, and eggplant.
The ideal VPD range
The Plant Empowerment approach works with a practical range of 0.3 to 1.5 kPa for most fruiting vegetables. Within that band:
- 0.3 to 0.6 kPa: comfort zone, minimal stress, good crop activity.
- 0.6 to 1.2 kPa: optimal production, strong transpiration and CO₂ uptake.
- 1.2 to 1.5 kPa: the top of the zone; watch for stress in sensitive varieties.
You will recognize these bands from any VPD chart, the grid of air or leaf temperature against relative humidity that shades the healthy zone in green. A VPD calculator does the same math for a single moment: enter the temperature and humidity and it returns the VPD value. Both are perfect for learning the idea, but a chart or a calculator only ever describes one reading, not the many microclimates spread across a real greenhouse.
What goes wrong outside the range
VPD too low (below 0.3 kPa)
The air is almost saturated and evaporation stops. A film of moisture forms on the leaf, the perfect breeding ground for Botrytis, powdery mildew, and Phytophthora. This typically happens at night and in the early morning, especially on clear spring nights when radiation cools the glass quickly. The dew point calculator shows at which temperature and humidity the leaf surface reaches the dew point.
VPD too high (above 1.5 kPa)
The plant can no longer keep up with the transpiration demand. Stomata close. Photosynthesis stops. Calcium transport stalls, and blossom end rot is waiting to happen. This shows up on sunny summer days with dry outside air, or when screens are pulled aggressively during the day.
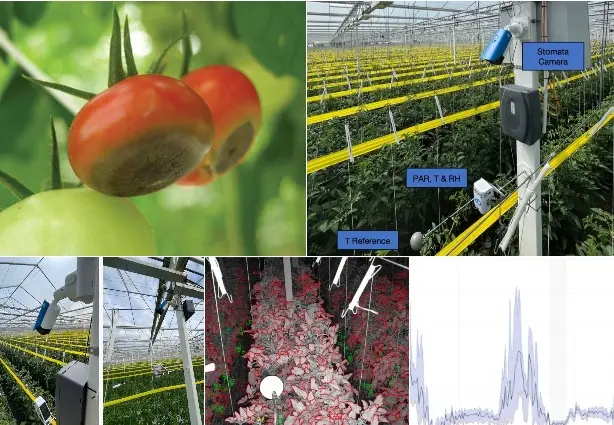
VPD and blossom end rot in tomatoes
This disorder is worth singling out, because VPD sits right at its root. Blossom end rot is not a disease but a local calcium shortage in the fruit, and calcium travels only with the transpiration stream. The fast-growing cells at the blossom end of a tomato are the first to miss out when that stream falters. Push VPD too high, the stomata close, transpiration to the fruit drops, and blossom end rot follows, classically in tomatoes but also in peppers and eggplant. Holding VPD in the 0.3 to 1.5 kPa range keeps calcium moving to the fruit, the most dependable way to keep the problem off your plants.
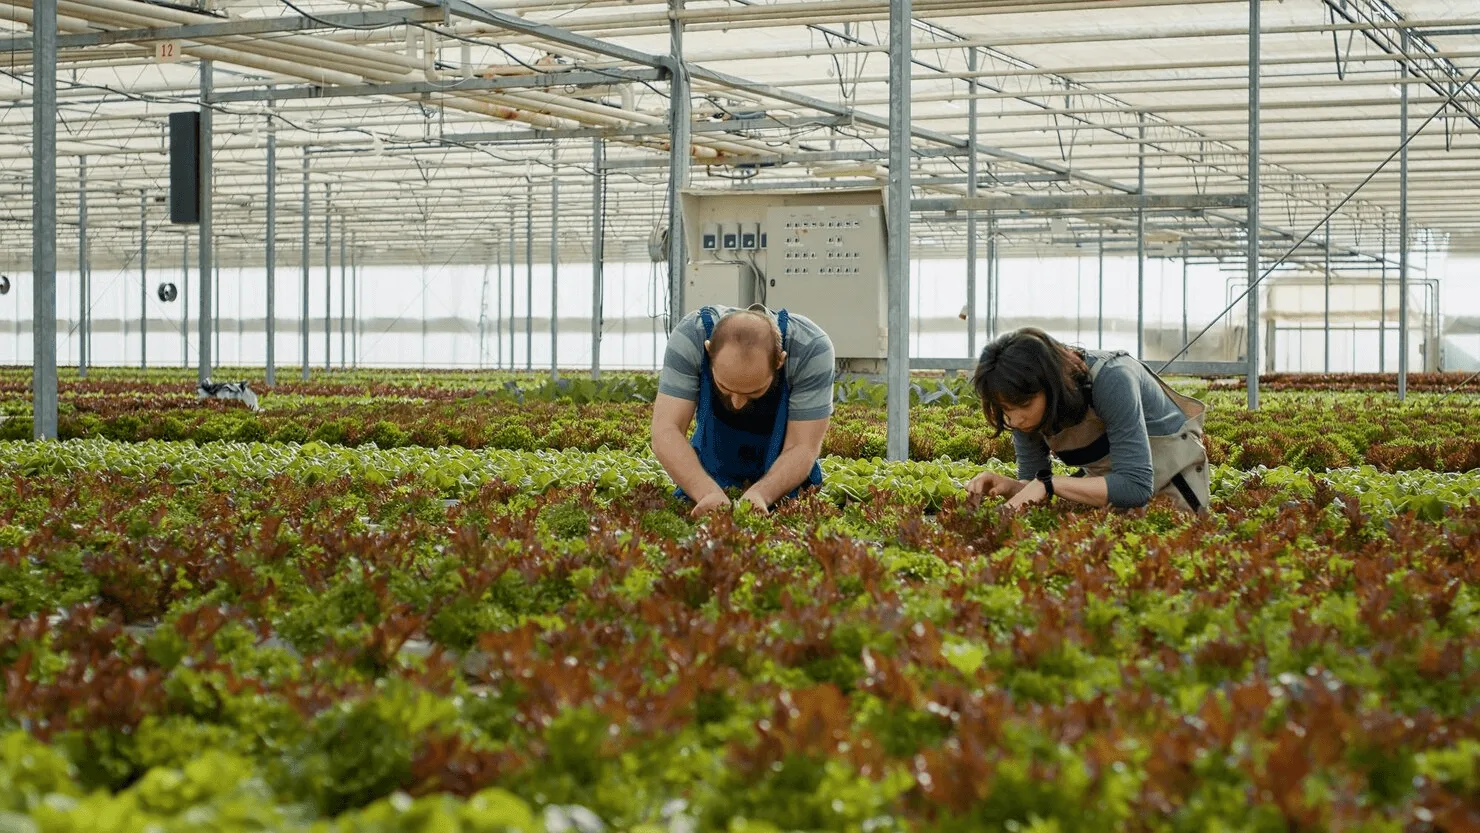
How do you measure VPD in the greenhouse?
The climate computer’s measuring box hangs in the aisle and reads aisle conditions, not what the crop actually experiences. Between the plant rows, under screens, and up at the crop head, VPD can differ considerably. Steer on the aisle value alone and you miss exactly the zones where things go wrong.
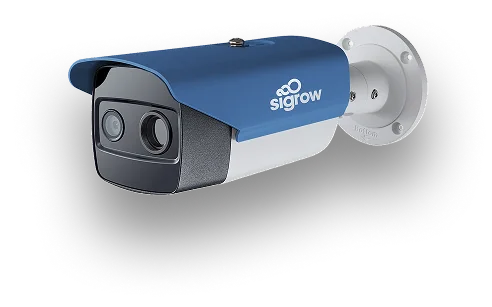
The Sigrow Pixel is a wireless sensor that hangs in the crop and measures VPD continuously at crop level. It combines leaf temperature (via infrared), air temperature, and humidity in one solar-powered unit. Place several Pixels in a grid and you see in real time which zones fall outside the VPD comfort zone, before any damage is done. The Air+ greenhouse climate sensor logs the air temperature and humidity that VPD is built from, right in the crop zone, so your chart reflects the air the plants actually sit in.
Beyond the air climate: VPD at leaf level
For growers who want to steer even more closely, the Sigrow Stomata Camera measures not only leaf temperature but also stomatal activity and the Real Transpiration Rate (Real RTR). That is VPD judged from the behavior of the plant itself, not just from the air around it.
Where to start
Start by measuring, not steering. Put Pixels in the three spots that least resemble your aisle: the crop head, the corner of the compartment, and under a screen. Compare the VPD readings over 7 days. The differences you find are the zones you can then steer with air movement, screen control, or dosing. Plot those readings against a VPD chart, or check a value quickly in a VPD calculator, and the spots that sit outside the safe band are exactly where to act.
Want to see how VPD behaves in your greenhouse? Book a short demo and look at the data from a comparable greenhouse. Reach the Sigrow team at success@sigrow.com (Mon to Fri, 9:00 to 18:00 CET) or support@sigrow.com (Mon to Fri, 9:00 to 21:00 CET).
Author

Related Blogs

- Grower Insights
By SigrowGreenhouse Ventilation in Extreme Heat: Why VPD Spikes
Open greenhouse ventilation wide in extreme heat and you dump the humidity and…- Grower Insights
By Mihnea ParaschivCan Limiting Ventilation Solve Heat Stress in Greenhouses?
Opening the vents isn’t always the answer to greenhouse heat stress. Why limiting…- Grower Insights
By SigrowBlossom End Rot in Tomatoes: It’s a Transpiration Problem
A tomato grower called with a familiar problem: blossom end rot, no obvious…

No Related Blogs Found
120-Day Promise
Try Sigrow for 120 days, risk-free. If it does not get your operation under tighter control, send the system back for a full refund of the hardware and the software subscription paid to date — no restocking fee.

We’re here to support you.
Questions, assistance, or just want to chat – reach out!