
VPD Calculator & VPD Chart
Work out vapor pressure difference from temperature and humidity, see where your crop sits against the healthy range, and read the full VPD chart. Built for growers, with leaf VPD and growth stage included.
Greenhouse VPD Calculator
A transpiring canopy usually runs 1 to 3 °C below air, and warmer under direct sun. Leave at 0 for air VPD, or set it for leaf VPD. The Stomata Camera measures leaf temperature directly.
Calculated with the Tetens equation, eₛ(T) = 0.61078 · e^(17.27T/(T+237.3)). Leaf VPD = eₛ(leaf) − eₛ(air) · RH/100. Stage targets are general guidelines. Read VPD in the greenhouse or measure it live at crop level with the Sigrow Pixel.
What VPD tells you
VPD (Vapor Pressure Difference) is how much more water the air can still take on before it saturates. It is not a background number. It drives transpiration, decides when stomata open, and carries calcium up through the plant, so it sits behind everything from growth rate to blossom end rot. Let it fall too low and the air turns muggy, which invites condensation and fungal disease. Let it climb too high and the crop closes its stomata and stops growing.
How this VPD calculator works
The calculator uses the Tetens equation for saturation vapor pressure and reports two numbers. Air VPD uses air temperature only. Leaf VPD uses leaf temperature, which is what the plant actually experiences. A leaf in full radiation can sit several degrees away from air temperature, so leaf VPD is the value worth steering on. Set the leaf offset to match your crop, or measure leaf temperature directly with the Sigrow Stomata Camera.
VPD chart: the ranges to steer by
These are the bands shaded on the gauge and the VPD chart above, the working range from the Plant Empowerment approach for most fruiting vegetables. Younger crops prefer the lower end, so use the growth-stage selector to shift the target.
VPD chart in degrees Celsius (kPa)
| °C \ RH | 50% | 55% | 60% | 65% | 70% | 75% | 80% | 85% | 90% | 95% |
|---|---|---|---|---|---|---|---|---|---|---|
| 16°C | 0.91 | 0.82 | 0.73 | 0.64 | 0.55 | 0.45 | 0.36 | 0.27 | 0.18 | 0.09 |
| 18°C | 1.03 | 0.93 | 0.83 | 0.72 | 0.62 | 0.52 | 0.41 | 0.31 | 0.21 | 0.10 |
| 20°C | 1.17 | 1.05 | 0.94 | 0.82 | 0.70 | 0.58 | 0.47 | 0.35 | 0.23 | 0.12 |
| 22°C | 1.32 | 1.19 | 1.06 | 0.93 | 0.79 | 0.66 | 0.53 | 0.40 | 0.26 | 0.13 |
| 24°C | 1.49 | 1.34 | 1.19 | 1.04 | 0.90 | 0.75 | 0.60 | 0.45 | 0.30 | 0.15 |
| 26°C | 1.68 | 1.51 | 1.34 | 1.18 | 1.01 | 0.84 | 0.67 | 0.50 | 0.34 | 0.17 |
| 28°C | 1.89 | 1.70 | 1.51 | 1.32 | 1.13 | 0.94 | 0.76 | 0.57 | 0.38 | 0.19 |
| 30°C | 2.12 | 1.91 | 1.70 | 1.49 | 1.27 | 1.06 | 0.85 | 0.64 | 0.42 | 0.21 |
| 32°C | 2.38 | 2.14 | 1.90 | 1.66 | 1.43 | 1.19 | 0.95 | 0.71 | 0.48 | 0.24 |
| 34°C | 2.66 | 2.39 | 2.13 | 1.86 | 1.60 | 1.33 | 1.06 | 0.80 | 0.53 | 0.27 |
VPD chart in degrees Fahrenheit (kPa)
| °F \ RH | 50% | 55% | 60% | 65% | 70% | 75% | 80% | 85% | 90% | 95% |
|---|---|---|---|---|---|---|---|---|---|---|
| 60°F | 0.88 | 0.80 | 0.71 | 0.62 | 0.53 | 0.44 | 0.35 | 0.27 | 0.18 | 0.09 |
| 64°F | 1.02 | 0.92 | 0.81 | 0.71 | 0.61 | 0.51 | 0.41 | 0.31 | 0.20 | 0.10 |
| 68°F | 1.17 | 1.05 | 0.94 | 0.82 | 0.70 | 0.58 | 0.47 | 0.35 | 0.23 | 0.12 |
| 72°F | 1.34 | 1.21 | 1.07 | 0.94 | 0.80 | 0.67 | 0.54 | 0.40 | 0.27 | 0.13 |
| 76°F | 1.53 | 1.38 | 1.23 | 1.07 | 0.92 | 0.77 | 0.61 | 0.46 | 0.31 | 0.15 |
| 80°F | 1.75 | 1.57 | 1.40 | 1.22 | 1.05 | 0.87 | 0.70 | 0.52 | 0.35 | 0.17 |
| 84°F | 1.99 | 1.79 | 1.59 | 1.39 | 1.19 | 0.99 | 0.80 | 0.60 | 0.40 | 0.20 |
| 88°F | 2.26 | 2.03 | 1.81 | 1.58 | 1.36 | 1.13 | 0.90 | 0.68 | 0.45 | 0.23 |
| 92°F | 2.56 | 2.31 | 2.05 | 1.79 | 1.54 | 1.28 | 1.02 | 0.77 | 0.51 | 0.26 |
Download the printable VPD chart: Celsius version · Fahrenheit version
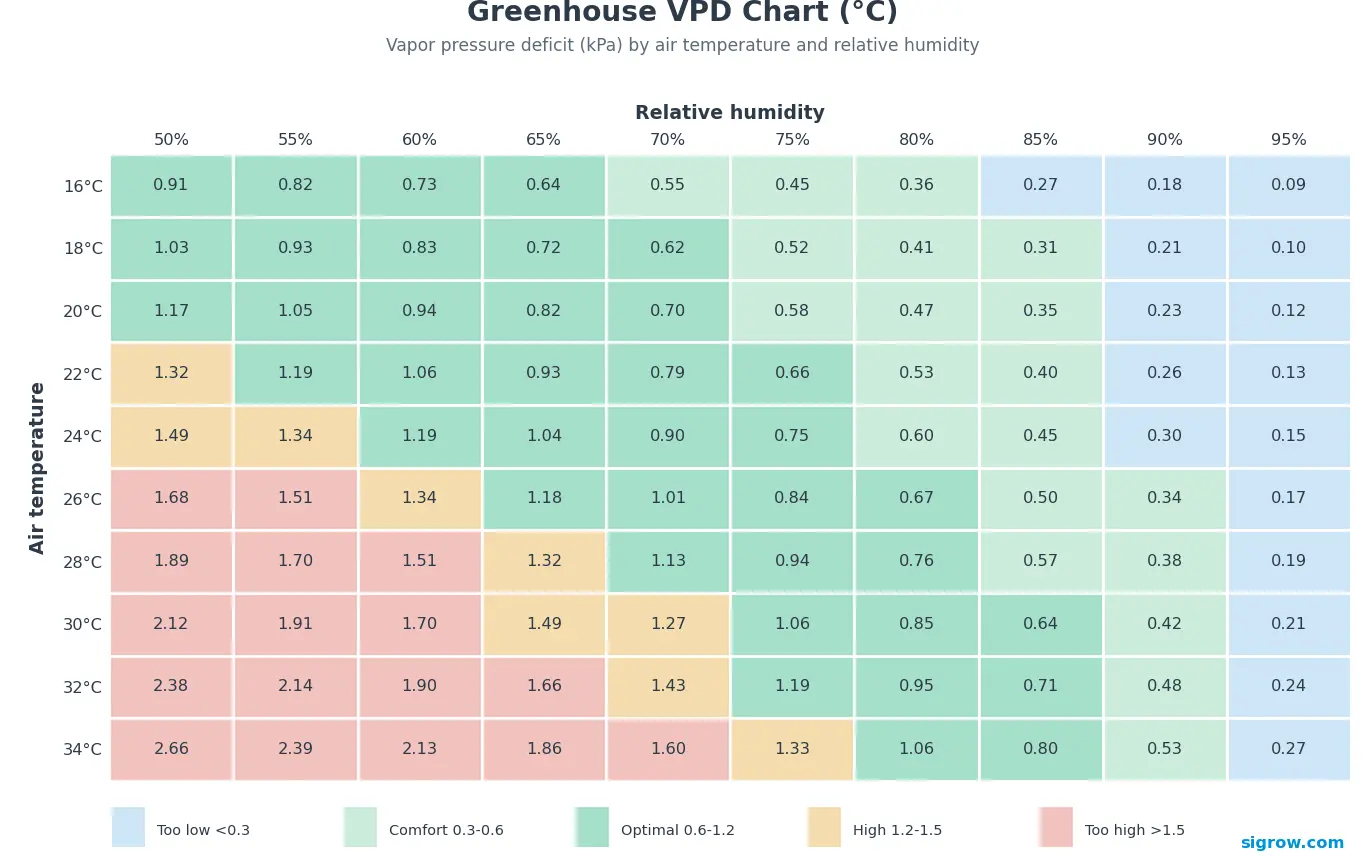
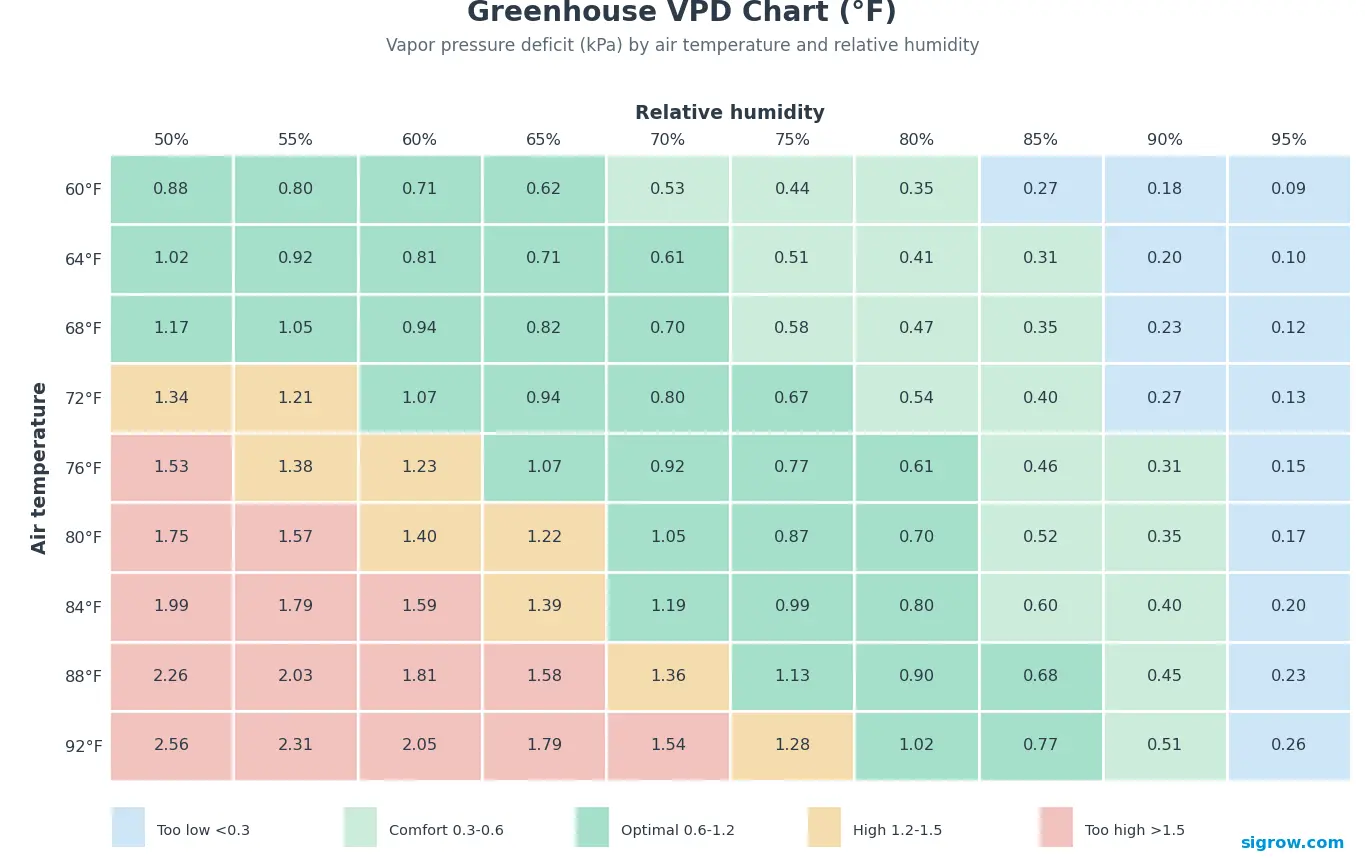
The chart above plots air VPD, the number you get from air temperature and relative humidity alone. It is a solid starting point, but it is not quite the climate the plant experiences. For that you have to measure in among the crop, not by the door or up in the gutter. The Air+ greenhouse climate sensor logs temperature and humidity right at canopy height, so the reading matches the air your plants actually sit in. Leaves usually run a little cooler than the air around them, which means leaf VPD lands lower than air VPD. Move the leaf-temperature offset in the calculator to see how far it shifts. Most charts just assume a fixed offset and estimate from there. The Sigrow Stomata Camera measures real leaf temperature off the plant itself, so you steer on true leaf VPD instead of a best guess.
- Below 0.3 kPa: too wet. The air is near its dew point, so condensation and Botrytis get their opening.
- 0.3 to 0.6 kPa: gentle and forgiving. Good for young plants, cuttings, and propagation.
- 0.6 to 1.2 kPa: the sweet spot for most fruiting vegetables. Transpiration and CO2 uptake both run strong.
- 1.2 to 1.5 kPa: the dry end. Workable for many crops, but watch sensitive varieties for stress.
- Above 1.5 kPa: too dry. Stomata close, photosynthesis stalls, and calcium transport falls away.
How to measure VPD in your greenhouse
A calculator or a VPD chart describes one set of conditions at one moment. A real greenhouse has dozens at once: the aisle, the crop head, the damp pocket under a closed screen. If you want to manage VPD, you have to measure it where the plants are and keep measuring. The Sigrow Pixel does that continuously at crop level. The Stomata Camera goes further and reads leaf temperature and true leaf VPD straight from the plant. That is the difference between calculating VPD and steering on it. For the full picture, read VPD in the greenhouse: what it is and how to steer it.
Frequently asked questions
What is a good VPD? For most fruiting vegetables, aim for 0.6 to 1.2 kPa during the day. Young plants and propagation prefer the lower end, around 0.3 to 0.6 kPa.
What is the difference between air VPD and leaf VPD? Air VPD is worked out from air temperature. Leaf VPD uses the leaf’s own temperature, which can sit several degrees off the air, so it reflects what the plant actually feels. When the two disagree, leaf VPD is the one to steer on.
How do you lower or raise VPD? To bring it down, add humidity or close the gap between leaf and air temperature. To push it up, vent, move the air, or add a little heat. Screens and CO2 dosing shift it too, either way depending on how you run them.
See your real VPD, not just a calculation
A calculator describes one set of conditions. Sigrow measures VPD continuously at crop level, across every zone of your greenhouse.
Book a demoSales & Customer Success: success@sigrow.com (Mon to Fri, 9:00 to 18:00 CET)
Technical Support: support@sigrow.com (Mon to Fri, 9:00 to 21:00 CET)