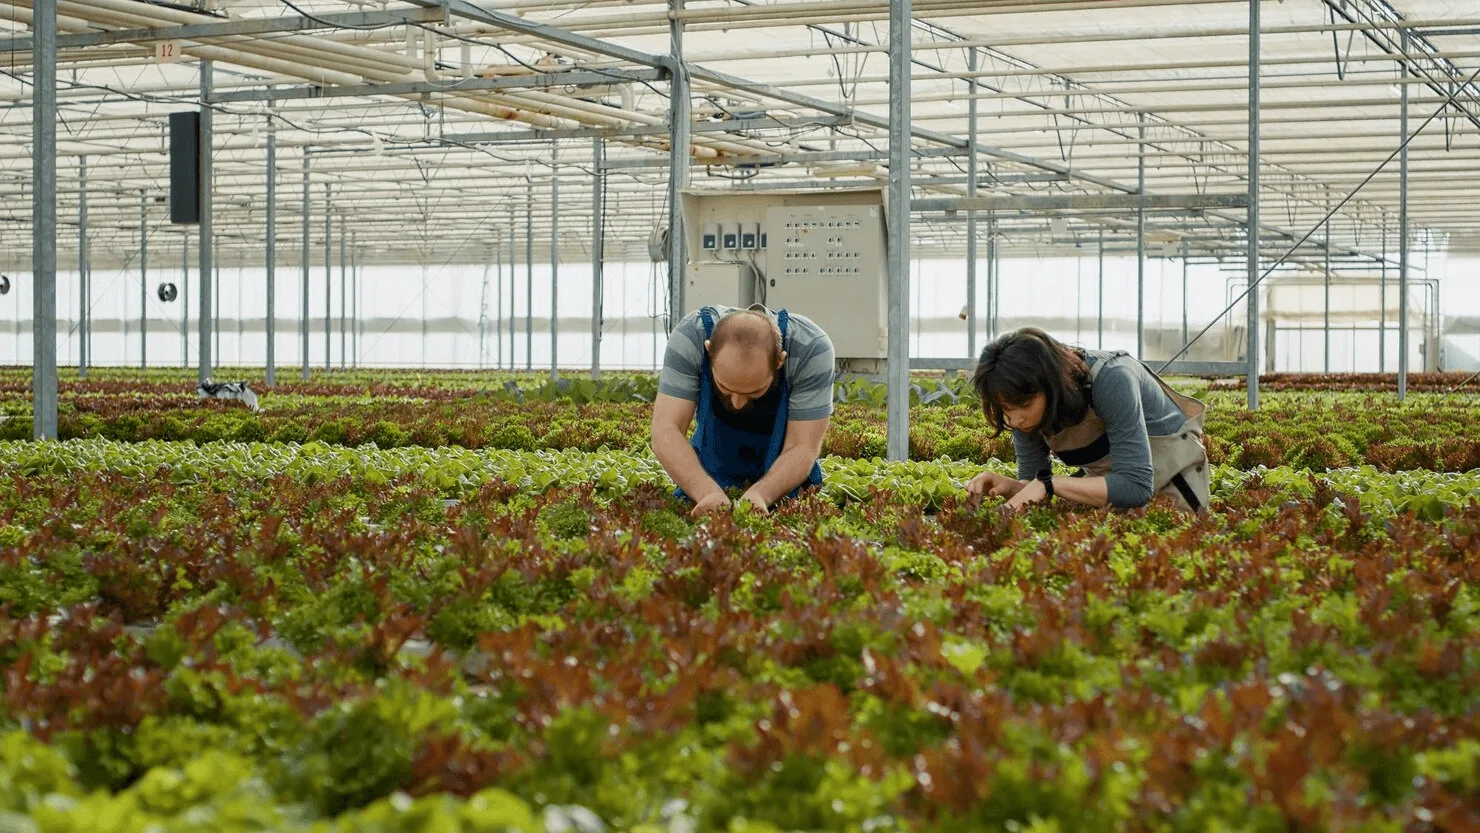
Greenhouse climate uniformity is how evenly temperature and humidity spread across a compartment. One measurement box can’t show it; sensors spread through the crop can.
The grower had checked everything twice.
Gaps in fruit set, but only in certain parts of the compartment. The climate data looked fine: 17 to 26 °C, 60 to 85% RH. The settings were reasonable. The sensors worked. “I can’t find the cause,” he told our plant scientists.
The cause wasn’t in the data he was reading. It was in the data he wasn’t measuring.
The 5 °C nobody saw
His climate computer said 25 °C. That number came from one measurement box in a one-hectare compartment, and it described that one spot accurately. It said nothing about the rest.
So Sigrow ran a climate uniformity test across the hectare. The spread was 5 °C. In some zones, the air was reaching 30 °C.
That’s where the bumblebees come in. In most protected vegetable crops, bumblebees do the pollinating, and they’re sensitive to heat. Above 30 °C their foraging drops sharply. In those hot pockets, the bees stopped visiting flowers.
No visit. No pollination. No fruit set.
The grower hadn’t made a growing mistake. His sensor was reporting the average, not the range. In summer, a pollination problem isn’t always a pollination problem. Sometimes the bumblebee is telling you something your sensor can’t.
Why we trust a bedroom more than a hectare
Think about the thermostat at home. Put it next to a window or an outside wall and it stops representing the room. The heating still responds, but to the wrong spot. Even in a small bedroom, we accept a difference of 1 to 2 °C between one corner and another.
A greenhouse is thousands of times bigger. Yet growers regularly tell us, “One measurement box per hectare is enough.”
When we add more sensors to compartments that were considered uniform, we have measured differences of several degrees within a single hectare. Colder, wetter zones sit next to warmer, drier ones, and the climate computer steers all of them on one reading from near the middle.
The physics behind the patchwork
The differences aren’t random. Physics explains all of them:
- Leaves set the temperature, then the air follows. A leaf’s temperature comes from radiation and transpiration, and the leaf then warms or cools the air around it.
- Warm air rises, cold air falls. Humid air rises and dry air sinks.
- Wind creates pressure differences. Wind on the facade pushes cold air in on one side.
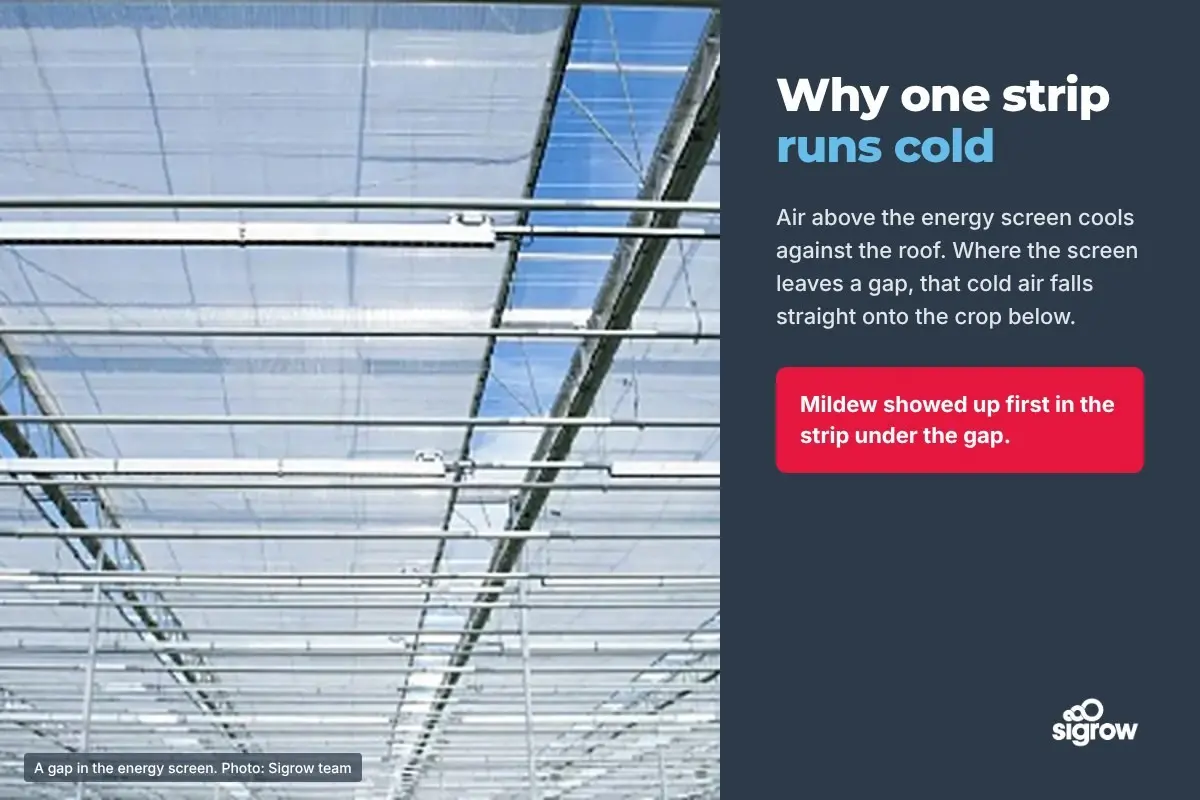
- Screen gaps leak cold air. Air above the screen cools and drops through the gap. In Sigrow heatmap data, that strip was 5 to 6 °C colder than the rest of the compartment, and that’s exactly where mildew appeared.
- Fans don’t move air the way the brochure draws it.
The problem is growing, not shrinking. Compartments are bigger, there’s more light, screens close for more hours (which means more gaps), and the climate outside is more extreme.
Up and down, too
Differences aren’t only side to side. Sigrow’s data from leaves, flowers and fruit shows the vertical profile matters just as much:
- Warm head: growth too fast, flower drop, cell damage, guttation.
- Cold head: less calcium and potassium uptake, condensation and mould.
- Warm feet: too much evaporation low in the crop.
- Cold feet: slower ripening, mould.
What uneven climate costs
Uneven growth and development stages across the compartment. More disease in the cold, wet zones. More stress in the warm, dry ones. Wasted energy, because the system heats some areas too much and others too little. And in the end, yield and quality that vary from row to row.
How to map it
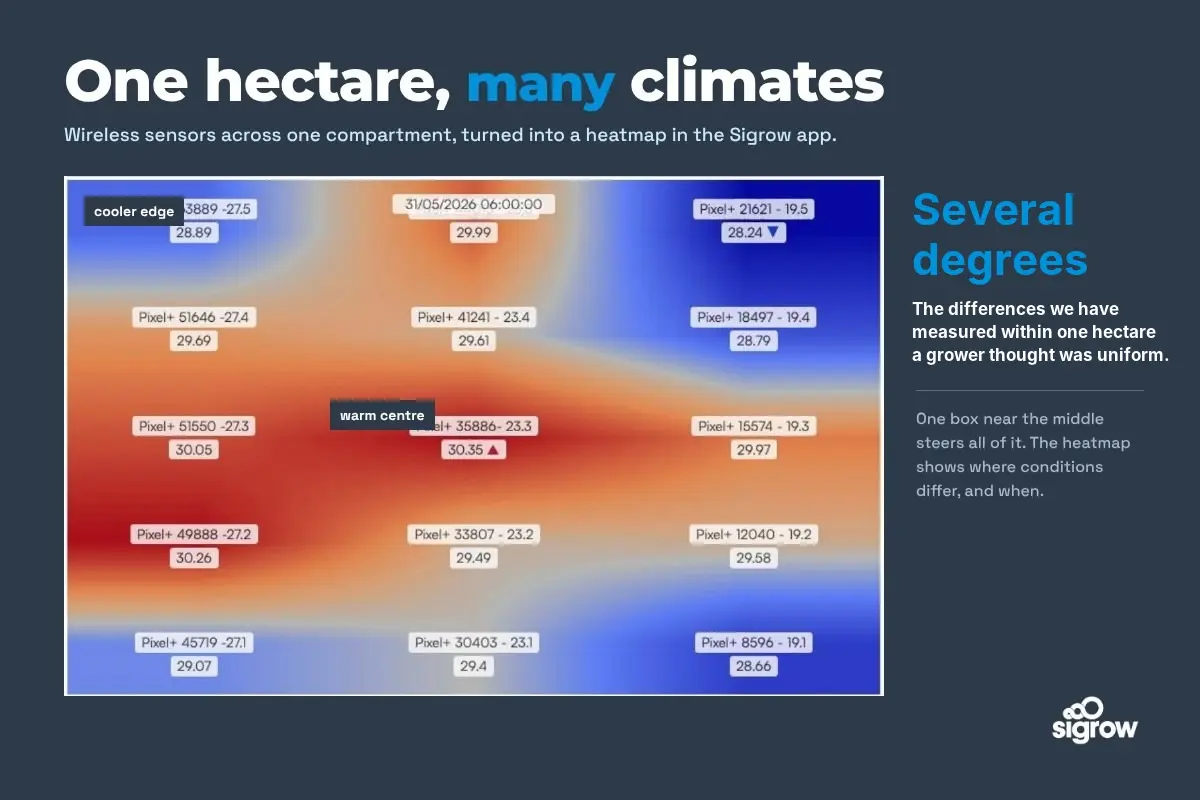
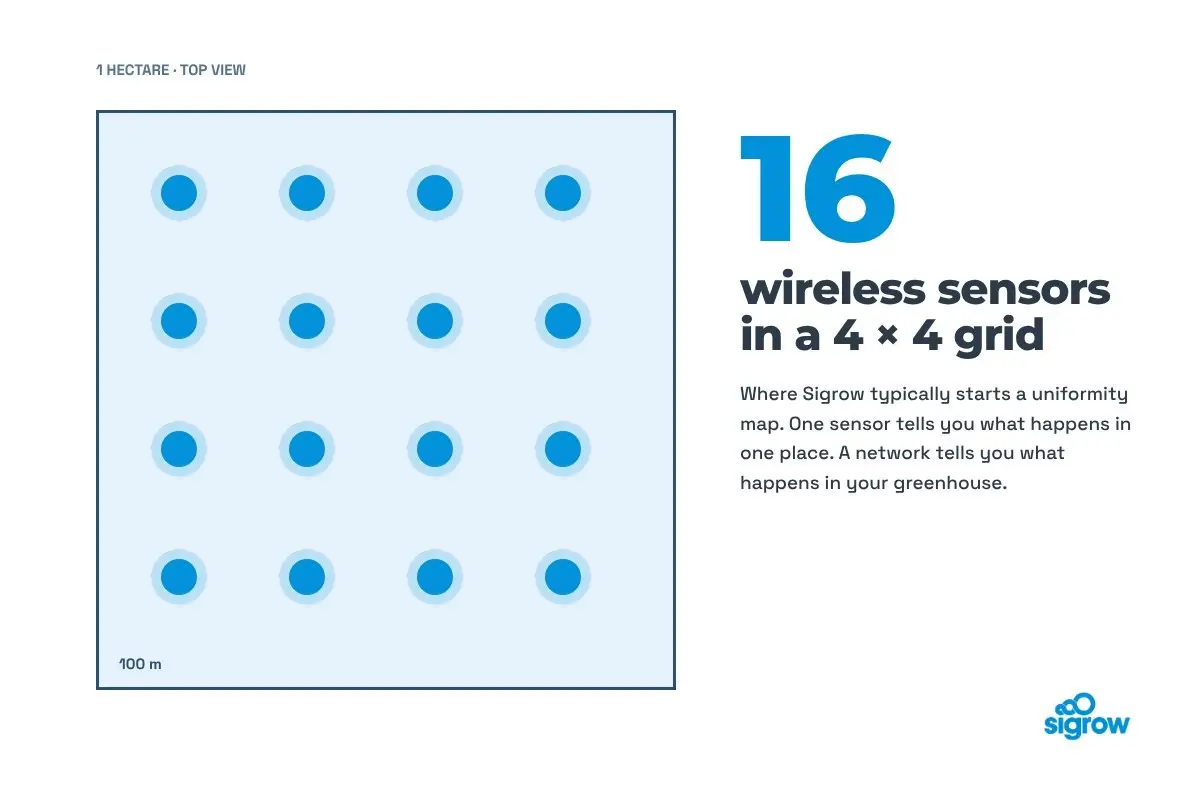
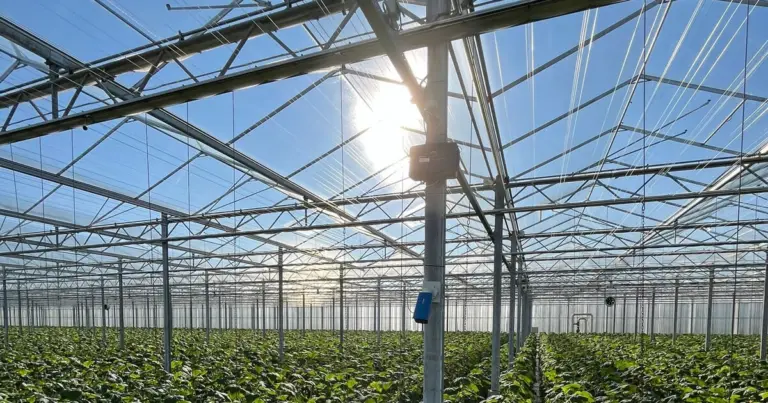
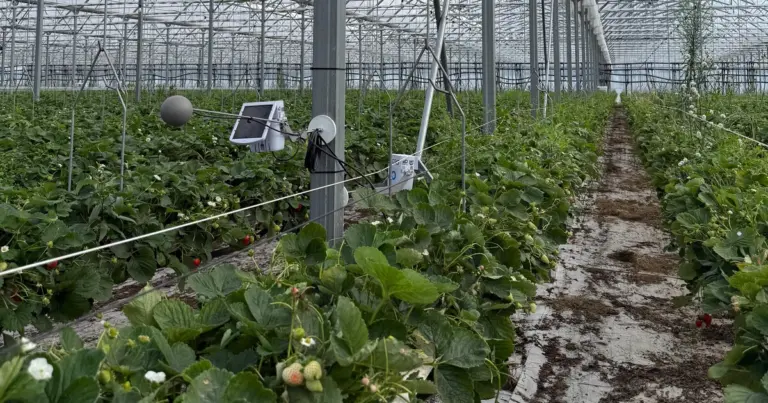
Start by measuring the variation instead of assuming it isn’t there. Sigrow typically starts with 16 wireless sensors per hectare in a 4 × 4 grid: Air+ sensors hung between the plants, or Pixel sensors that also read leaf temperature. The Sigrow app turns those readings into a map of the compartment, so you can see where conditions differ and when.
Then the conversation changes. It’s no longer “what is the greenhouse temperature?” but “where is it different, why, and what can we change?”
Sensors don’t fix anything on their own. They show you where to act, and whether the action worked.
What growers change once they can see it
The causes are usually practical: doors opened too often, very cold irrigation water, screen gaps, venting on one side only, sun exposure (the south side becomes warmer than the north) and wind on the facade. Most of the fixes are small:
- Airtight screens, and vertical partitions above the screen.
- Venting on both sides, and steering the windward vents separately.
- Vertical circulation fans, placed so every part of the compartment gets moving air.
- Injecting dry air from above the screen.
- Heating pipes above the crop.
- Apex seals to fine-tune horizontal air movement.
It’s also worth mapping where problems show up, such as fruit-set gaps or disease, and checking whether that pattern matches the airflow. It often does.
One box, one spot
One sensor tells you what’s happening in one place. A network tells you what’s happening in your greenhouse. And your crop has been living in the second one all along.
FAQ
How many climate sensors do I need per hectare?
One measurement box can’t show variation. Sigrow typically starts uniformity mapping with 16 wireless sensors per hectare in a 4 × 4 grid.
How big are temperature differences in a greenhouse?
We have measured differences of several degrees within one hectare in compartments the grower considered uniform.
What causes cold spots in a greenhouse?
Common causes are screen gaps letting cold air drop, wind on the facade, doors, venting on one side, cold irrigation water and the angle of the sun.
Does climate uniformity matter more in summer or winter?
Both. In summer, radiation creates hot zones; in winter, cold air drops and condensation zones dominate.
See your own map
Got a corner that has always behaved a little oddly? That’s a good place to start looking. If you’d like to map it properly, our plant scientists can help you plan it.
Author

Related Blogs

- Grower Insights
By SigrowWhat Is RTR? How to Calculate the Ratio of Temperature to Radiation for Your Crop
RTR is the 24-hour temperature a crop gets per mol of light: how…- Grower Insights
By SigrowHow Much Drain Is Enough? What 38% Less Drain Water Looked Like in Strawberries
A strawberry trial cut drain water by 38% and total water by 19.5%…- Grower Insights
By Timon van LemmenWarm Days, Cold Nights: Why Your Tomato Crop’s Dew Point Margin Matters
A respectable 24-hour average can hide a night on the dew point and…

No Related Blogs Found
120-Day Promise
Try Sigrow for 120 days, risk-free. If it does not get your operation under tighter control, send the system back for a full refund of the hardware and the software subscription paid to date — no restocking fee.
We’re here to support you.
Questions, assistance, or just want to chat – reach out!